Reversals in Forex Trading: Unveiling the Potential of the Doji Star Pattern#
Introduction#
The Doji Star pattern is a popular candlestick formation in technical analysis that indicates potential market reversals. It is characterized by a small-bodied candle, known as a Doji, that forms a star-like pattern on the price chart. In this article, we will explore how to recognize both the bullish Doji Star pattern and the bearish Doji Star pattern. Additionally, we will delve into the psychological dynamics underlying these patterns, offering insights into the mindset of market participants during these formations.
Recognizing the Bullish Doji Star Pattern#
The bullish Doji Star pattern is a two-candle formation that suggests a potential reversal from a downtrend to an uptrend. Here are the key characteristics to look for when identifying a bullish Doji Star pattern:
The first candle is a bearish candle, indicating selling pressure.
The second candle is a Doji, characterized by a small body with little or no real body. The Doji opens and closes near the same price level, signifying indecision in the market.
The Doji is followed by a larger bullish candle that confirms the reversal, reflecting an increase in buying pressure and potential shift in market sentiment.
The Psychology of the Bullish Doji Star Pattern#
The bullish Doji Star pattern reveals important psychological dynamics at play in the market. Consider the following aspects:
Initial Selling Pressure: The first bearish candle signifies a prevailing downtrend and selling pressure.
Indecision and Market Uncertainty: The formation of the Doji candle indicates a state of indecision among market participants. Buyers and sellers are in equilibrium, uncertain about the future direction of the market.
Shift in Sentiment: The subsequent bullish candle following the Doji suggests a change in sentiment. Buyers regain confidence, stepping in to take control of the market and potentially reversing the downtrend.
Buyers’ Optimism: The presence of a bullish Doji Star pattern can instill optimism among buyers, leading to an influx of new buyers entering the market, pushing prices higher.
Recognizing the Bearish Doji Star Pattern#
The bearish Doji Star pattern is the opposite of its bullish counterpart, signaling a potential reversal from an uptrend to a downtrend. Here’s how to spot a bearish Doji Star pattern:
The first candle is a bullish candle, indicating buying pressure.
The second candle is a Doji, showing indecision in the market as it opens and closes near the same price level.
The Doji is followed by a larger bearish candle that confirms the reversal, suggesting an increase in selling pressure and a potential shift in market sentiment.
The Psychology of the Bearish Doji Star Pattern#
The bearish Doji Star pattern also reflects underlying psychological factors that can impact market behavior:
Initial Buying Pressure: The first bullish candle indicates an ongoing uptrend and buying pressure.
Indecision and Market Uncertainty: The appearance of the Doji candle represents a state of uncertainty among traders. Buyers and sellers are evenly matched, unsure about the future direction of the market.
Reversal Potential: The subsequent bearish candle following the Doji confirms a potential reversal. Sellers gain confidence, overpowering buyers and potentially initiating a downtrend.
Sellers’ Pessimism: The presence of a bearish Doji Star pattern can instill pessimism among sellers, attracting additional sellers to the market, and driving prices lower.
Paramters for the backtests#
For this particular analysis, we worked with the following parameters:
Starting balance: $10,000
Margin: 1:100
Commission: None
Testing period: From January 1, 2020, to December 31, 2022
Timeframe: 15 minutes
Currency pair: EURUSD
Data Source: Dukascopy
Backtesting the Doji Star bullish and bearish strategy#
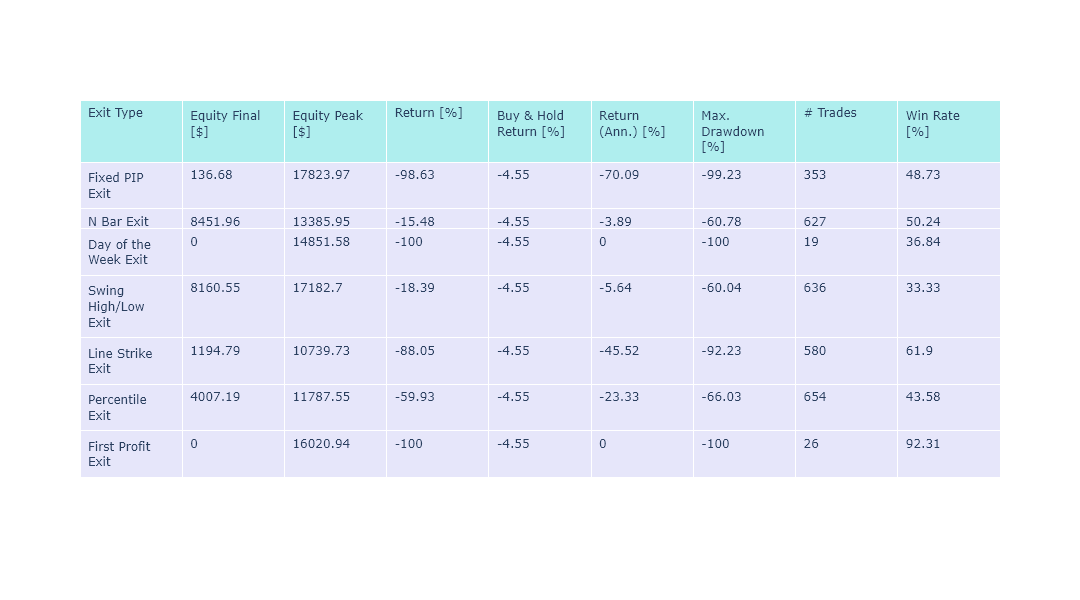
Backtesting the Doji Star candlestick pattern by going long on the bullish Doji Star and going short on the bearish Doji Star, while experimenting with various exit strategies, is a critical step in evaluating the effectiveness of this trading approach. By utilizing historical price data and establishing specific trading rules, traders can simulate trades based on the occurrence of Doji Star patterns. This allows them to test the profitability and robustness of the strategy.
Moreover, by conducting backtesting across different exit strategies, traders can gain valuable insights into the potential profitability and risk management aspects associated with trading the Doji Star candlestick pattern.
Buy Rules
Identify the bullish Doji Star candlestick.
Sell Rules
Identify the bearish Doji Star candlestick.
Results

Backtesting the Doji Star candlestick and Pivot Points strategy#
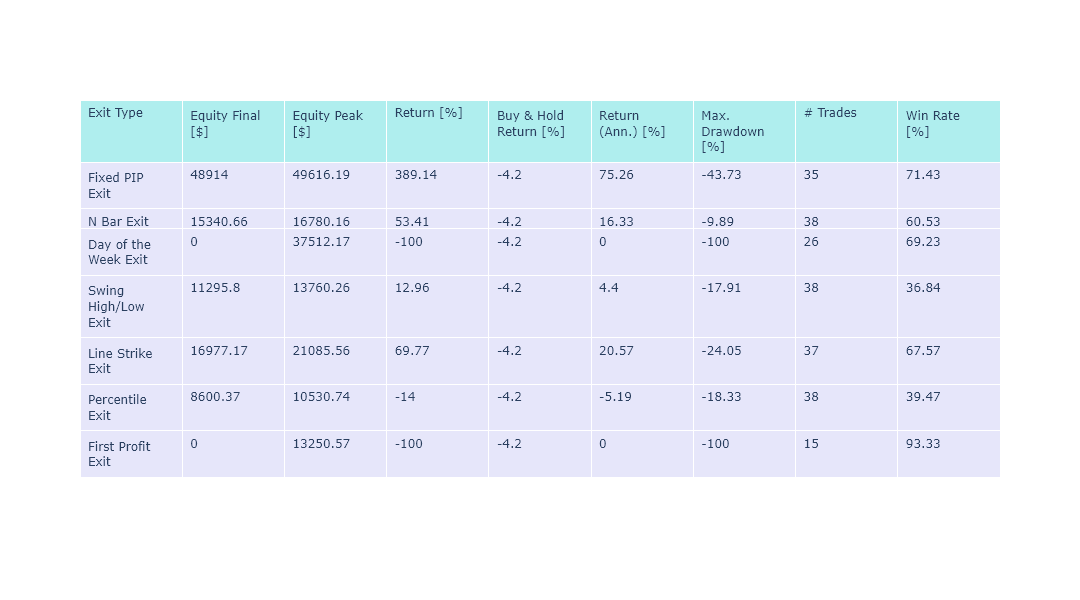
In our rigorous testing, we’ve explored two versions of this strategy that we can’t wait to share with you. But that’s not all - we’re also going to push the boundaries and test it across a range of diverse exit strategies. Before we delve deeper, let’s take a moment to introduce the pivot points that play a pivotal role in our analysis. The pivot points we use are:
Version 1
Buy Rules
Close of the bullish Doji Star must be above the resistance pivot point.
Sell Rules
Close of the bearish Doji Star must be below the support pivot point.
Results

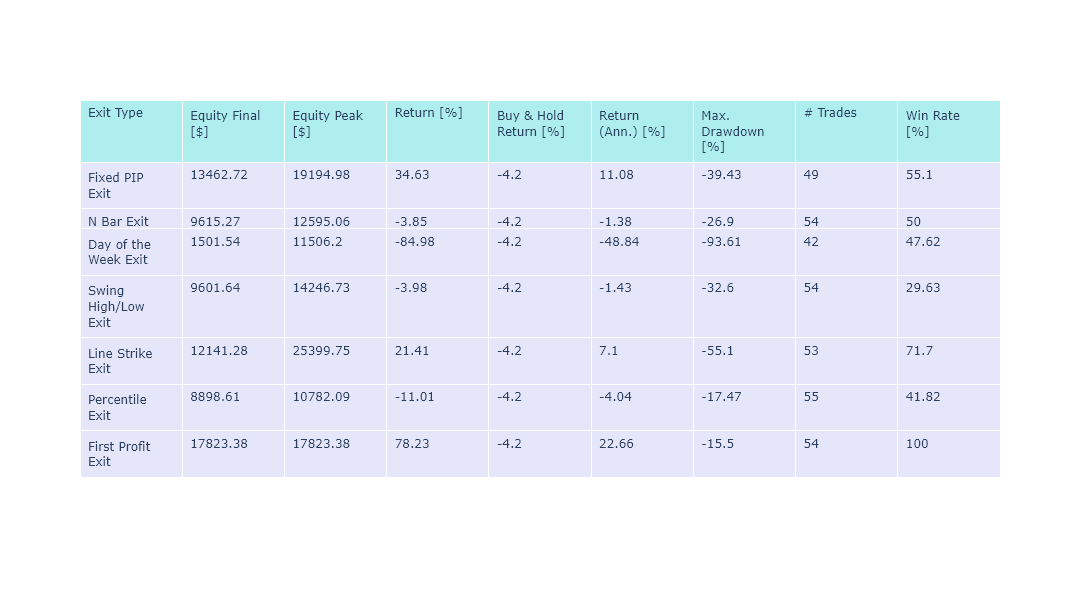
Version 2
Buy Rules
Close of the bullish Doji Star must be below the support pivot point.
Sell Rules
Close of the bearish Doji Star must be above the resistance pivot point.
Results

Source Code#
Here is the link to the source code for this zeta-zetra/code.
